Market Intelligence Data
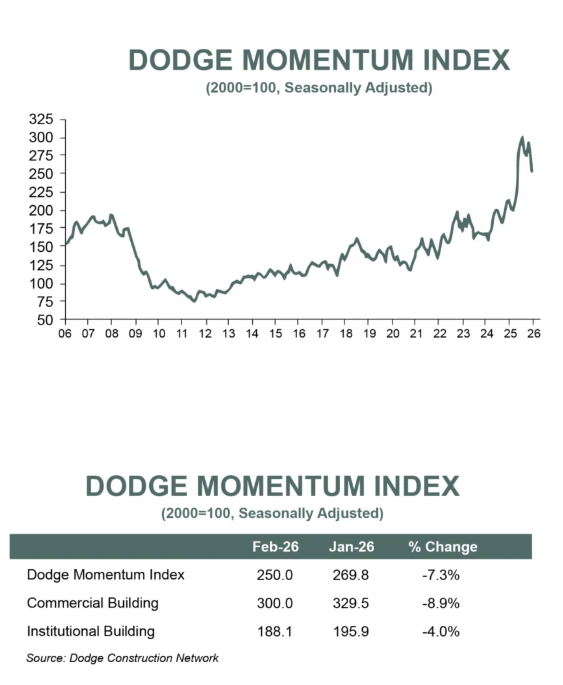
Dodge Momentum Index Declines 7% in February
Nonresidential Planning Continues to Normalize
BOSTON, MA – March 6, 2026 — The Dodge Momentum Index (DMI), issued by Dodge Construction Network declined 7.3% in February to 250.0 (2000=100) from the downwardly revised January reading of 269.8. Over the month, commercial planning fell 8.9%, and institutional planning momentum slowed by 4.0%.
“Planning momentum continued to normalize in February after a surge in activity in the back half of 2025,” said Sarah Martin, Associate Director of Forecasting at Dodge Construction Network. “Elevated risks around costs, labor, and geopolitics will continue to constrain builder confidence in the near-term but the robust planning pipeline suggests an acceleration in construction spending in 2027.”
On the commercial side, planning momentum slowed across all commercial sectors apart from warehouses. Within institutional planning, all sectors slowed down with public buildings facing the largest contraction. Despite widespread declines, project momentum for retail stores, recreational buildings, data centers and healthcare facilities remain elevated. Year-over-year, the DMI was up 18.7% when compared to February 2025. The commercial segment was up 12.3% (+4.4% when data centers are removed) and the institutional segment was up 34.0% over the same period.
A total of 23 projects valued at $100 million or more entered planning throughout February. The largest commercial projects included the $500 million CyrusOne Data Center in Whitney, Texas, the $448 million TX12 Data Center in San Antonio, Texas and Buildings 5 and 6 of the QTS DFW2 Data Center in Wilmer, Texas – each valued at $290 million. The largest institutional projects to enter planning were the $400 million Orange County Convention Center Grand Concourse expansion (Phase 5A) in Orlando, Florida, a $254 million school replacement project in Upper Marlboro, Maryland, and the $250 million Langley F-22 Dormitory Building in Mclean, Virginia.
The DMI is a monthly measure based on the three-month moving value of nonresidential building projects going into planning, shown to lead construction spending for nonresidential buildings by a full year to 18 months.
NEW ENGLAND - Mar 5, 2026. Ed Zarenski (www.edzarenski.com) reports:
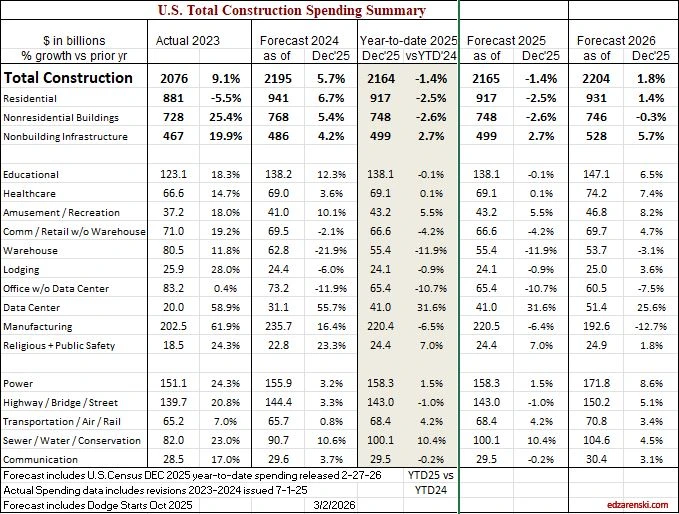
First pass at forecast 2026, includes first Census report of final 2025 spending. 2025 will be revised several times in the coming months, Dec and Nov are still subject to revision. All of this is behind what would be normal schedule due to shutdowns. Then all of 2025 will be revised, often a more significant revision, with the release of May data on July 1. However, this represents my initial Outlook for 2026 spending. More to soon follow on jobs and inflation.
SPENDING
Tracking spending throughout the year:
There are several months during the year when spending is remarkably consistent. For instance, over a period of 25 years, June and July have averaged 9.1% and 9.2% of actual annual spending, with a high/low range variation of less than +/- 0.25%. August and September have the highest rates of annual spending, but with slightly higher rates of variation. January and February have the lowest share of annual spending with the highest rates of variation. May, June, July and August have the lowest rates of variation from average across 25 years. Using subsets of months with the lowest variation in annual spending is a way to check forecasts during the year.
If we add up the total NSA (Not Seasonally Adjusted) Construction $ spent in AMJJAS (Apr thru Sep) and divide by the statistical average spending for those 6 months, 23 out of 25 times the result is within less than +/-0.75% of the final total annual spending. So once we have September data we have a subset that usually predicts the final spending outcome for the year within less than 1%. If we add up the total (NSA) Construction $ spent in MJJA (May thru Aug) and divide by the statistical average spending in those 4 months, 24 out of 25 times the result will be within less than +/-1.25% of total annual spending. Both of these subsets of data, for the last three years, predicted final annual spending within less than +/-0.5%.
My forecasts as of July and again as of August data in 2025 were both within less than 1% of the reported final annual spending through December data. My forecasts for Nonresidential Buildings, since June data, have been within +/-0.5% of final 2025 spending.
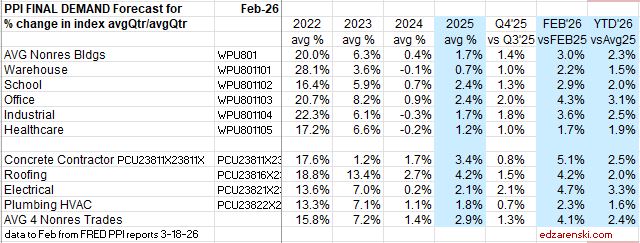
INFLATION
Notice in the table below, I carry inflation at about 4% in 2025 and similar in 2026. Actual inflation values are a composite of eight different sources, so the inflation carried in these reports will never be the highest or lowest. Predicted inflation reverts to historical averages with some influence of current conditions. Taking 4% out of all the spending numbers above gives the Constant$ results or actual volume of business conducted. For 2025 business volume declined 5.1%. For 2026 it’s expected to decline about 2.3%.
An increase in gasoline/diesel prices results in an increase on every single material item used in construction. If it’s not delivery charges, it’s heavy onsite machinery operation to install. Fuel surcharges are not uncommon in construction contracts. It could also be in fuel needed to manufacture products. The current world situation may/will have adverse effects on future construction inflation.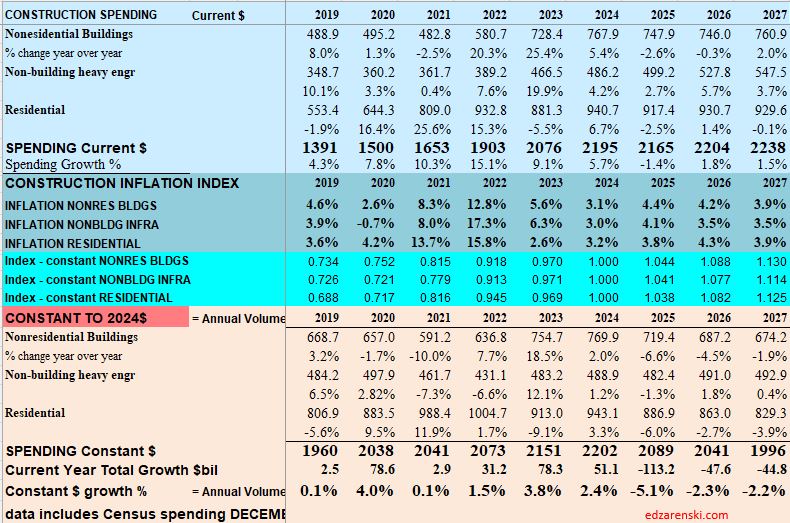
Constant $ adjusts all spending for inflation to represent dollars spent at the same point in time. Throughout these analyses, Constant $ are adjusted to midyear 2024. Constant $ is a measure of the change in business volume.
Inflation increases revenues but adds nothing to business volume. If your construction business revenue increased less than 5.1% in 2025, your total revenues did not even keep up with inflation. Your real business growth fell in 2025.
PPI
Data through February for individual Producer Price Index items. PPI items do not reflect imports, so tariffs would not be reflected in these numbers. Also current world oil situation would not yet be captured in values through February. I would expect to see numerous line items and total inputs increase in future months.
Cost of Inputs YTD thru Feb is showing the fastest rate of inflation recorded since 2022.
Construction PPI
largest gain in last month Deisel +20%, but still down -11% from average 2025
largest gains over last 6mo Aluminum +43%, Copper +21%, Steel +9%, Paving +9%
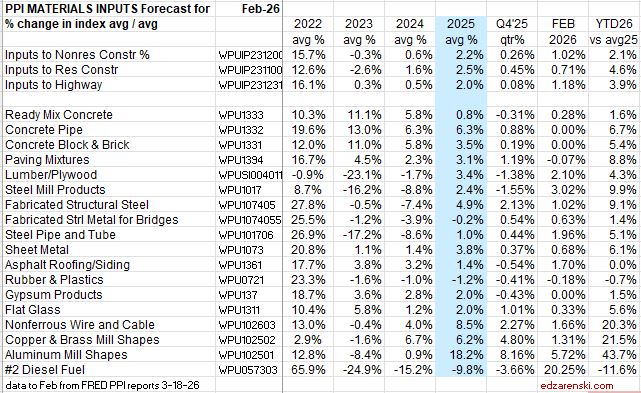
Almost all 2025 final cost inflation was added in Q4 2025, and in every case YTD’26 inflation has increased since Q4.
JOBS
Construction jobs from Dec24 to Dec25 fell by 4,000. But the better comparison, Avg’25 vs the Avg’24, increased by 58,000. However, spending was indicating a decline in jobs. Current $ spending in 2025 declined -1.4% or $30bil. After inflation, or Constant$ spending, declined -5.2%. That would indicate a decline of 400,000 jobs, but jobs seldom fall at the same rate as spending.
When constant$ spending declines more than jobs, that indicates a decline in productivity. It’s safe to say that construction productivity is at its lowest point in over 30 years, and by the looks of the following plot, probably the lowest ever.
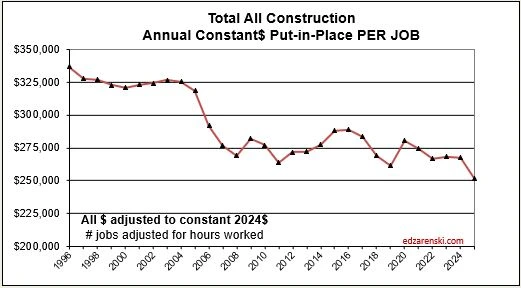
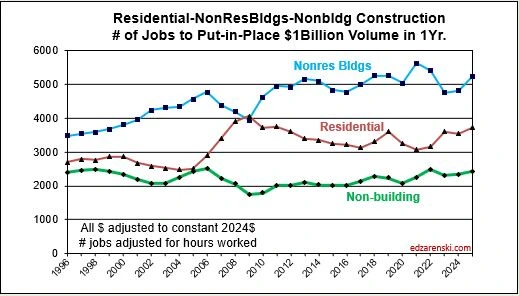
The inverse of $ put-in-place per job (the plot above) is # of jobs to put-in-place a given amount. The plot below does that for $1 billion worth of construction volume. For every billion$ of volume Nonres Bldgs, it takes about 5,000 jobs one year to put-in-place. For residential it’s only about 3,700 jobs. Both vary from year to year. For Nonbldg infrastructure jobs it takes only about 2,500 jobs to put-in-place $1billion in one year.
Although Current$ spending in 2026 is expected to increase slightly, Constant$ spending after inflation is projected to fall about 2.5%, indicating a decline of 200,000 jobs. Once again, don’t expect jobs to fall at the same rate as spending, so don’t expect a decline of 200,000 jobs, but I don’t expect even slow jobs growth like we see in 2025.
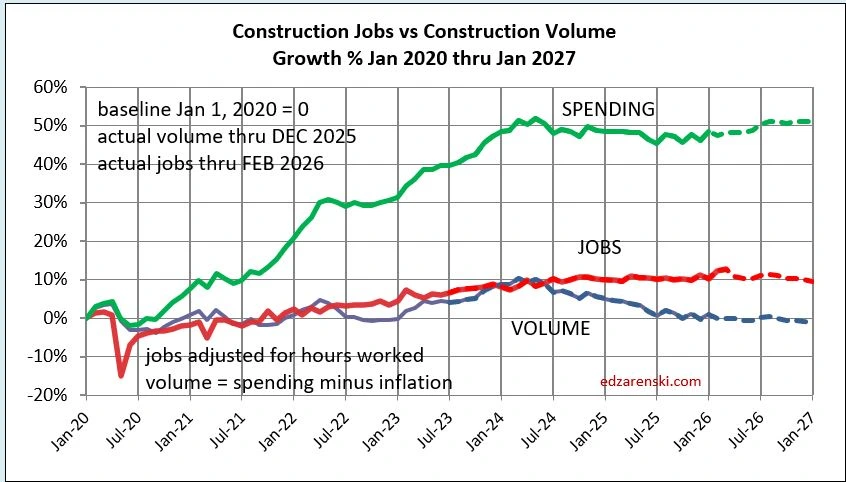
YTD through Feb. 2026, construction jobs are up 50,000 over Jan-Feb 2025. That’s kind of a hard to believe number, since construction Constant$ spending, or real construction volume, is forecast down 1.5% or $2.5bil (NSA not seasonally adjusted) over the same two month period. That would have us suspect a loss of 10,000 jobs. Even more astonishing is that workforce hours worked over the same 2 month period ’26 vs ’25 increased 2.5% or the equivalent of +200,000 jobs.
In 2022, 2023 and 2024, jobs increased in 35 out of 36 months. Construction volume fell in 14 out of those 36 months, but average volume increased all three years. We added 680,000. Total 3yr annual average volume increased 8%.
In 2025 plus Jan-Feb 2026, construction jobs declined in 9 out of 14 months. Volume has fallen in 10 out those 14 months. Jobs are down only 0.6% since Dec 2024. Volume fell 5.1% in 2025 and is forecast to fall 2.3% in 2026. Currently there is no growth in volume to support jobs growth.
January 2026 posted the largest construction jobs increase (+48,000) in 4 years. There has been no consistent increase in volume to support jobs growth since the 1st half of 2024.
Unemployment and productivity includes only jobs counted in the official U.S. Census Bureau of Labor Statistics (BLS) jobs report. There is a large, unaccounted for shadow workforce in construction. By some accounts, 40% or more of the construction workforce in California and Texas are immigrant workers. Immigrants may comprise between 14% and 22% of the total construction workforce. It is not clear how many within that total may or may not be included in the U.S. Census BLS jobs report. However, the totals are significant enough that they would alter some of the results commonly reported.
Project Highlights
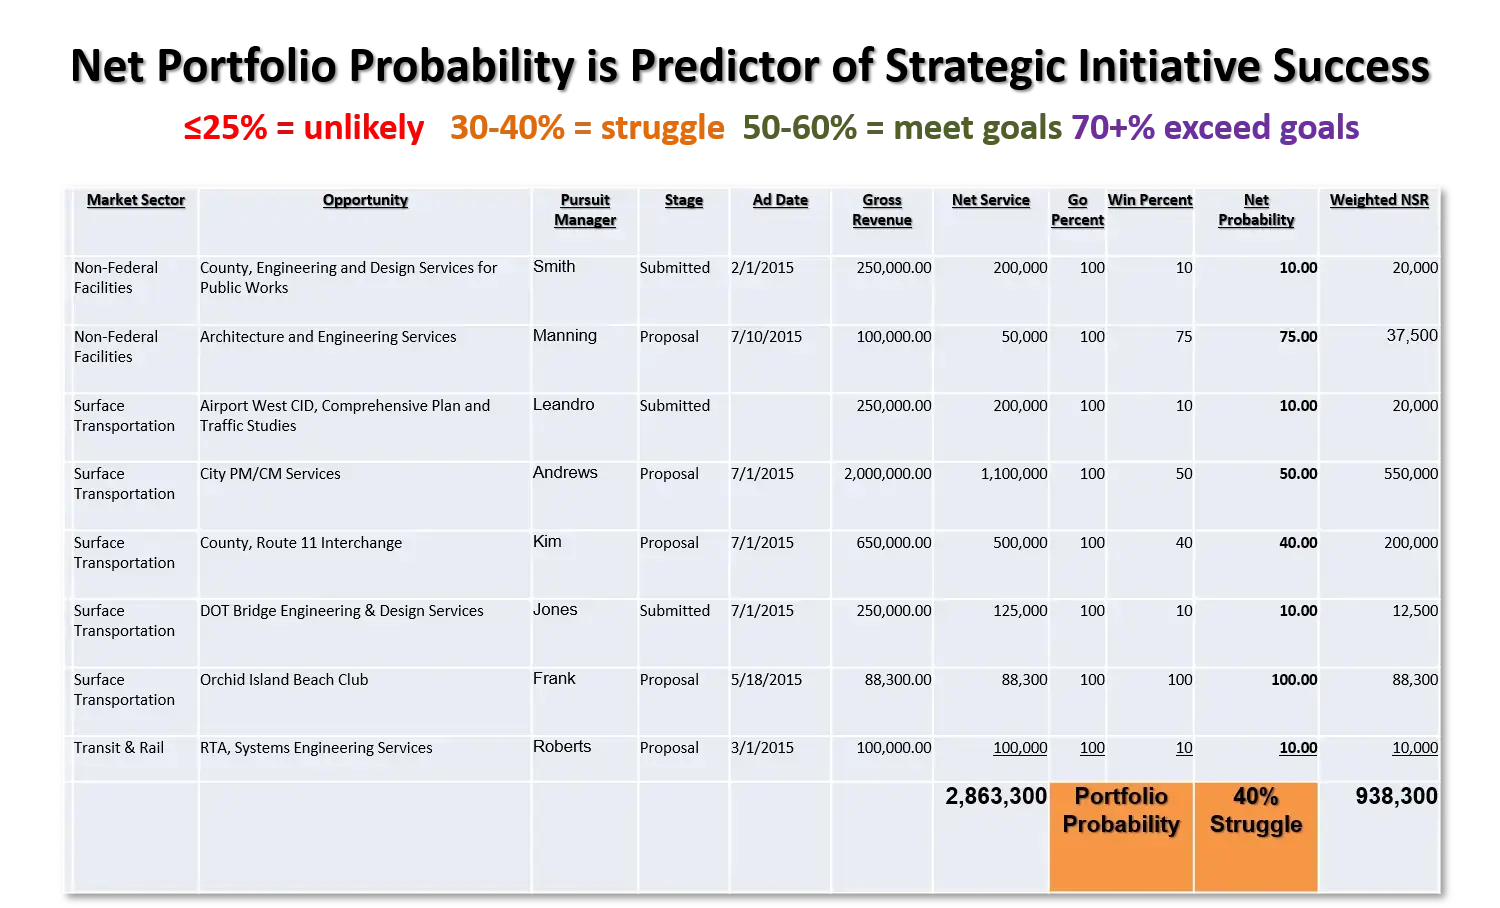
Portfolio Approach to Opportunity Management
ENR Top 30 Firm achieved goals of accelerating growth and profitability by implementing comprehensive business development training and strategic pursuit leadership program.
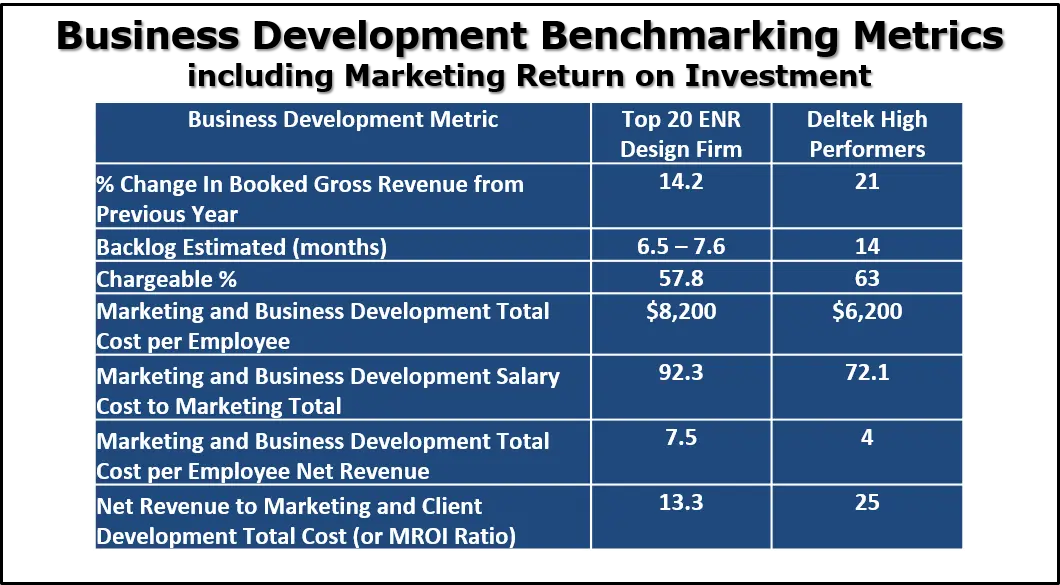
Business Development Assessment to Drive Market Growth and Leadership
The assessment pinpointed ways for an ENR Top 20 Design Firm to boost growth by improving leadership, resource use, and business development culture.

Don Sherman Joins TeknoGRID Board
TeknoGRID is proud to announce that Donald Gary (D.G.) Sherman has joined its newly formed Broadband Advisory Board.
Are you and your leadership prepared for a repeat of the 2008-2011 AEC market shifts?
Are double digit growth, excellent profitability, strong utilization and high win rates sustainable? Let us help you proactively control your whether there is a boom or a bear market for your services.